Lesson 1
Introduction to Visual Analytics and Applications
20 May 2025
Motivation of Visual Analytics
The World is full of charts that lie!
We need to get smarter about visual information
Motivation of Visual Analytics
Junk charts are good for advertising but not for understanding.
Motivation of Visual Analytics
Data rich, information poor

Source: Big Data Ocean
Motivation of Visual Analytics
The World is buried in data,
Just SHOW me the number

Motivation of Visual Analytics
Spreadsheet: A great hammer but lousy screwdriver
Visual analytics come to the rescue
Motivation of Visual Analytics
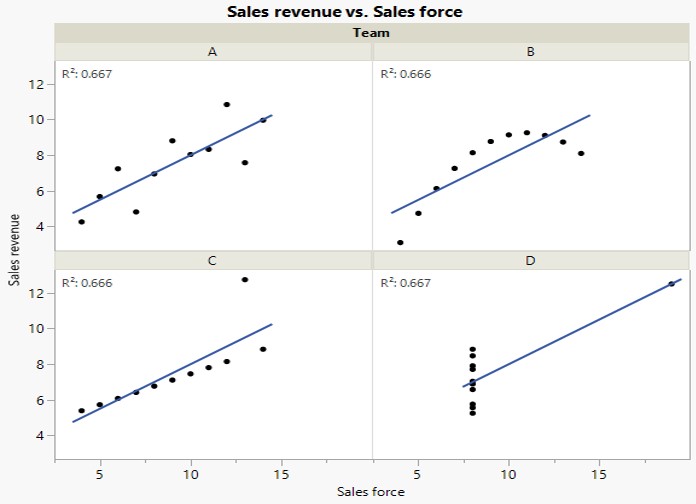
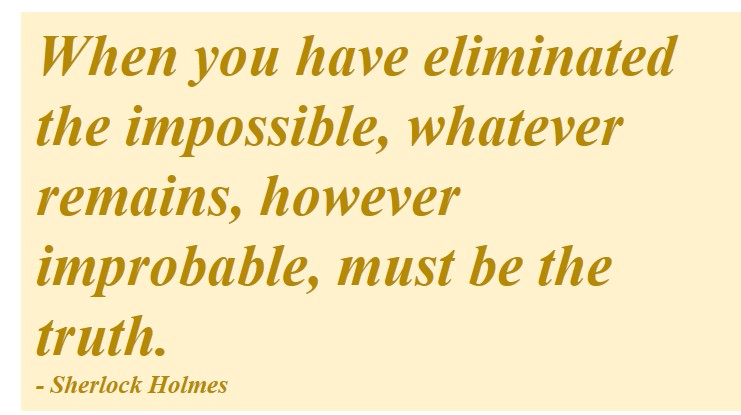
When statistics failed!
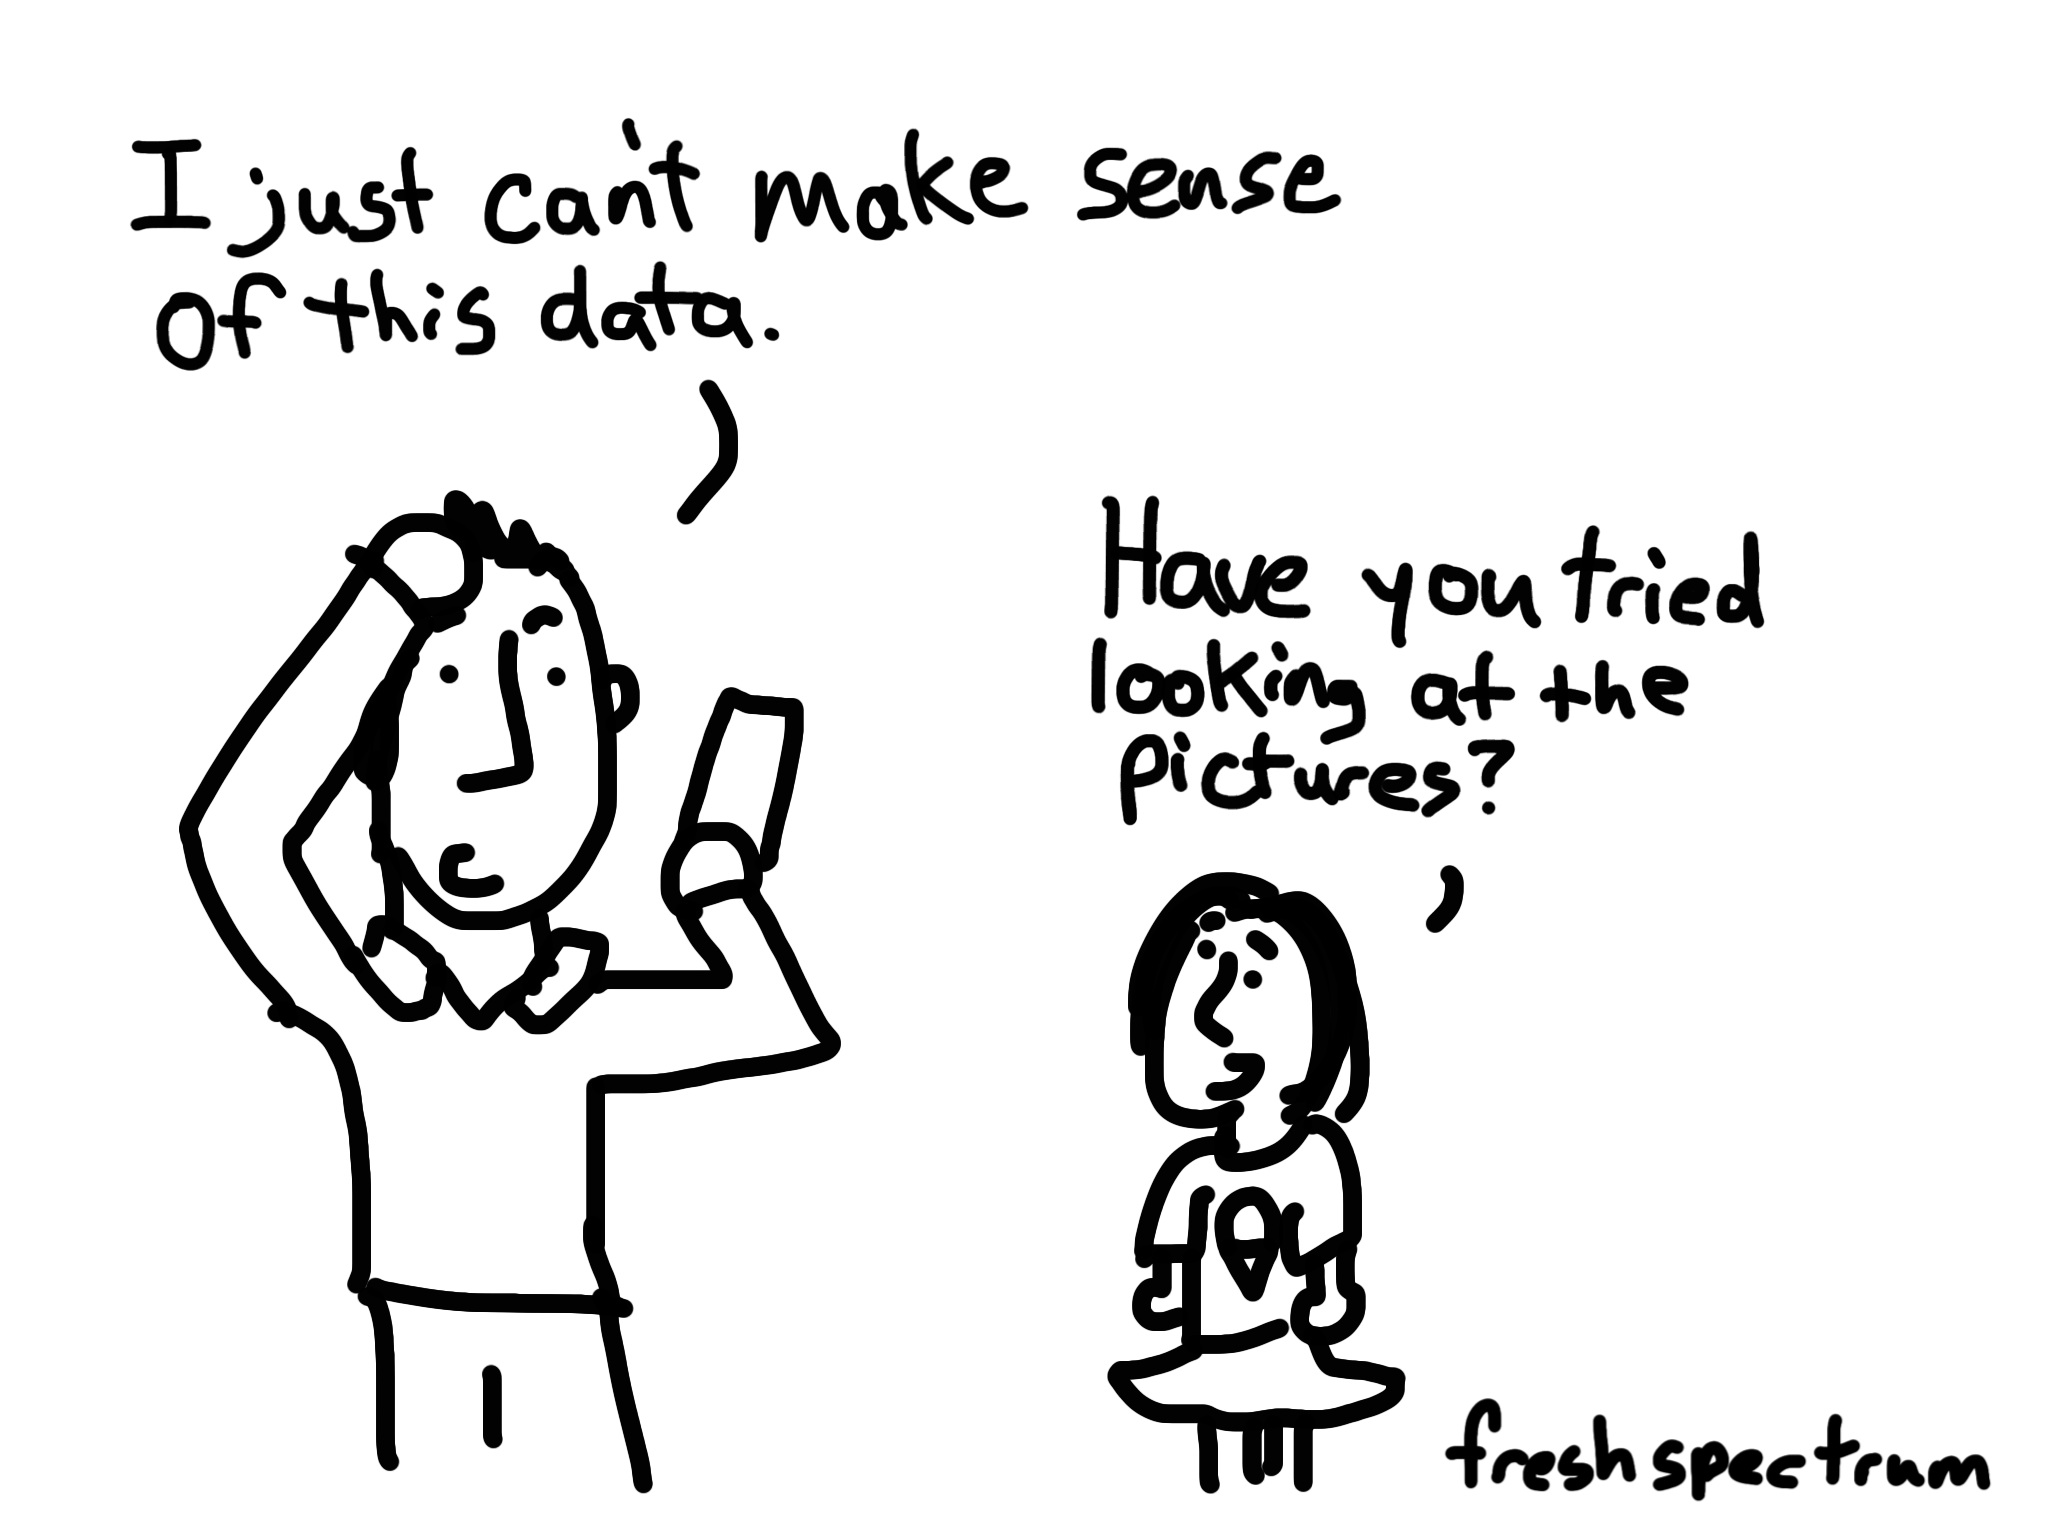
Data analysis without data visualisation is no data analysis
Motivation of Visual Analytics
Analytical graphics reveal the truth
Motivation of Visual Analytics
Is there a place for Visual Analytics in knowledge discovery?
Motivation of Visual Analytics
Open data need to be unlocked!
Visit the link
Motivation of Visual Analytics
Democratising Data and Analytics with Visually-driven Web Apps
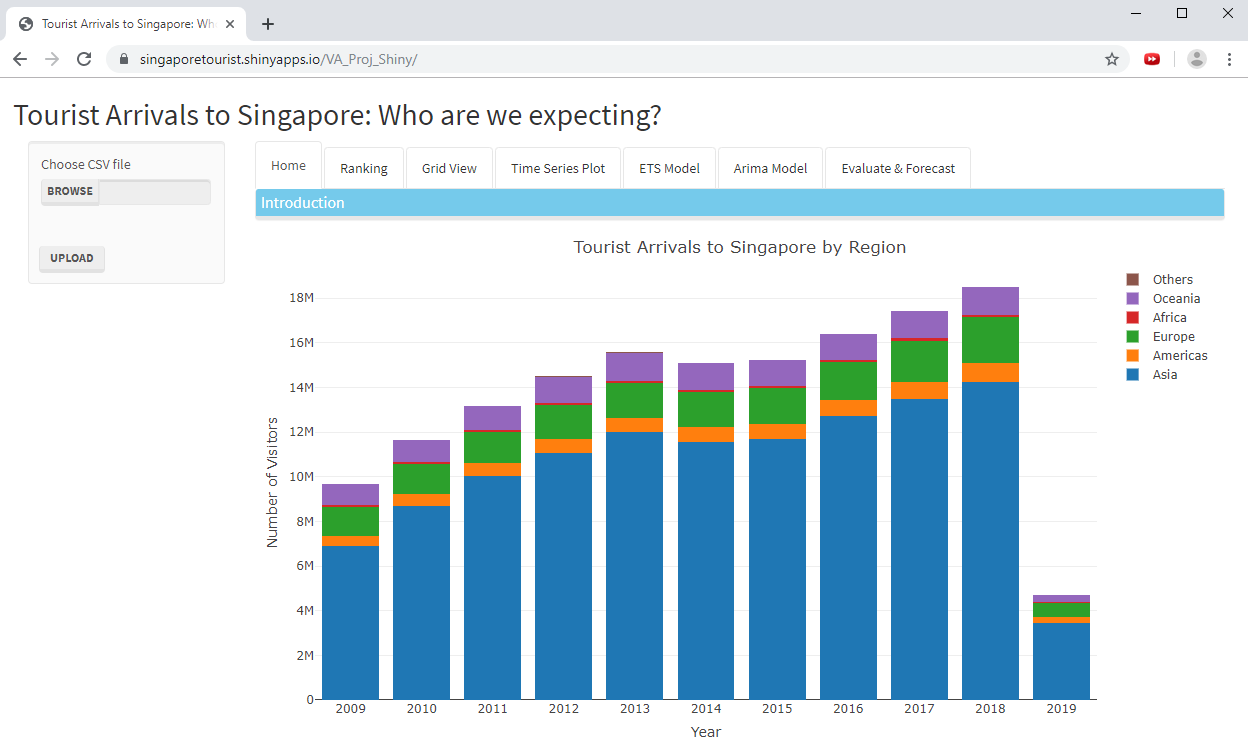
Visit the link
What is Visual Analytics?
Visual Analytics is the craft of analytical reasoning supported by:
- Data Science and Analytics
- Data Visualisation
- Human-Computing-Interaction (HCI)
- Interface Design
- Visual Storytelling

The marriage of data analytics and visualizations
What is Visual Analytics?
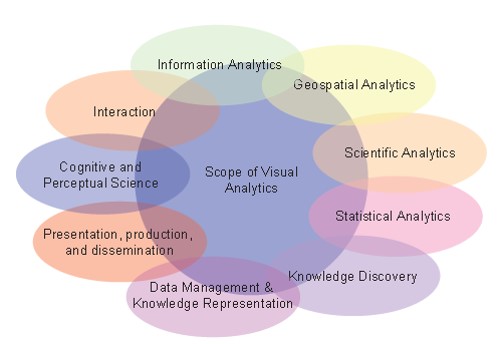
Science of Visual Analytics
What is Visual Analytics?
Aims of Visual Analytics

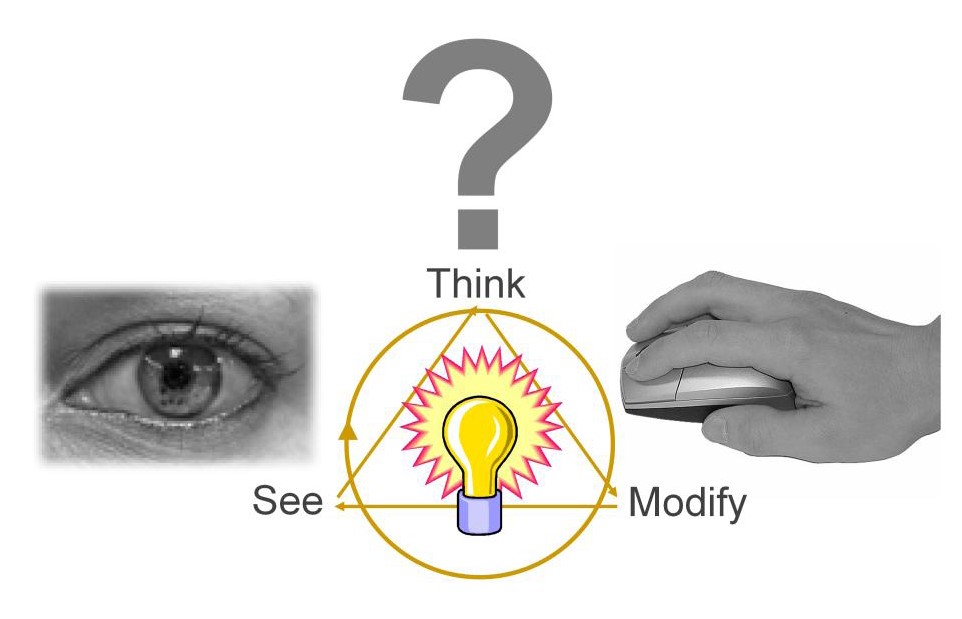
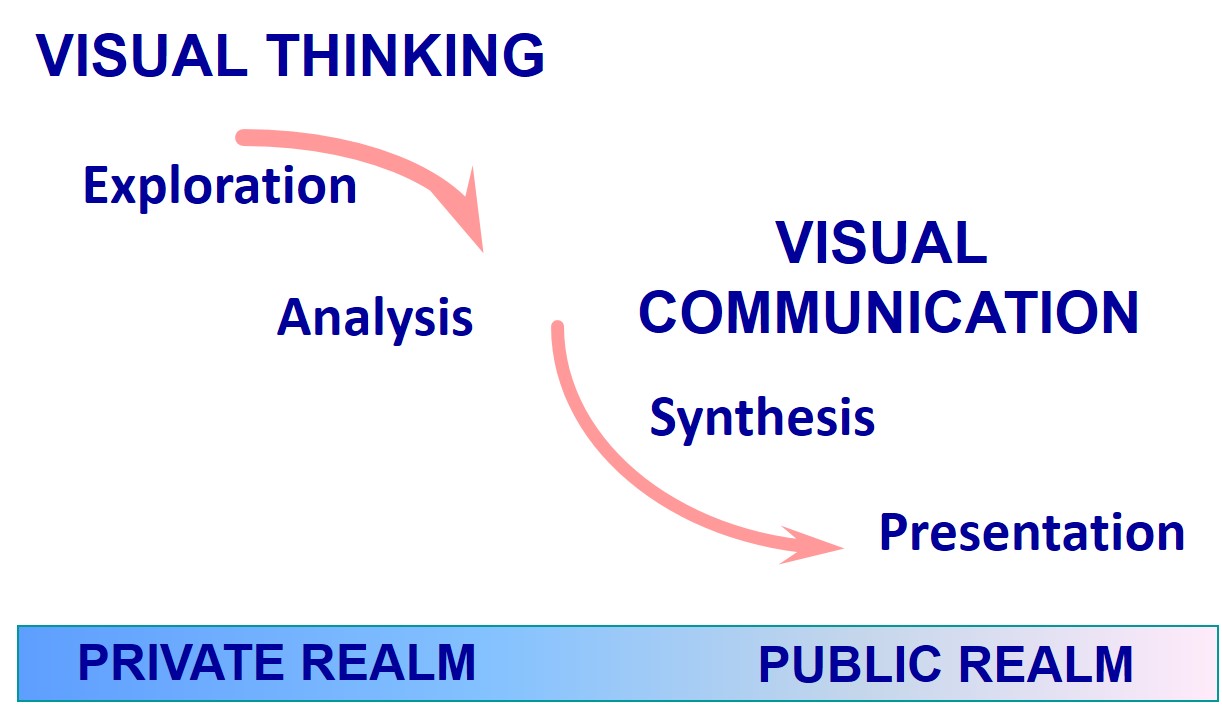
What is Visual Analytics?
Visual Data Sense-making
Visual Analytics’ greatest strength is its use for sense-making.

What is Visual Analytics?
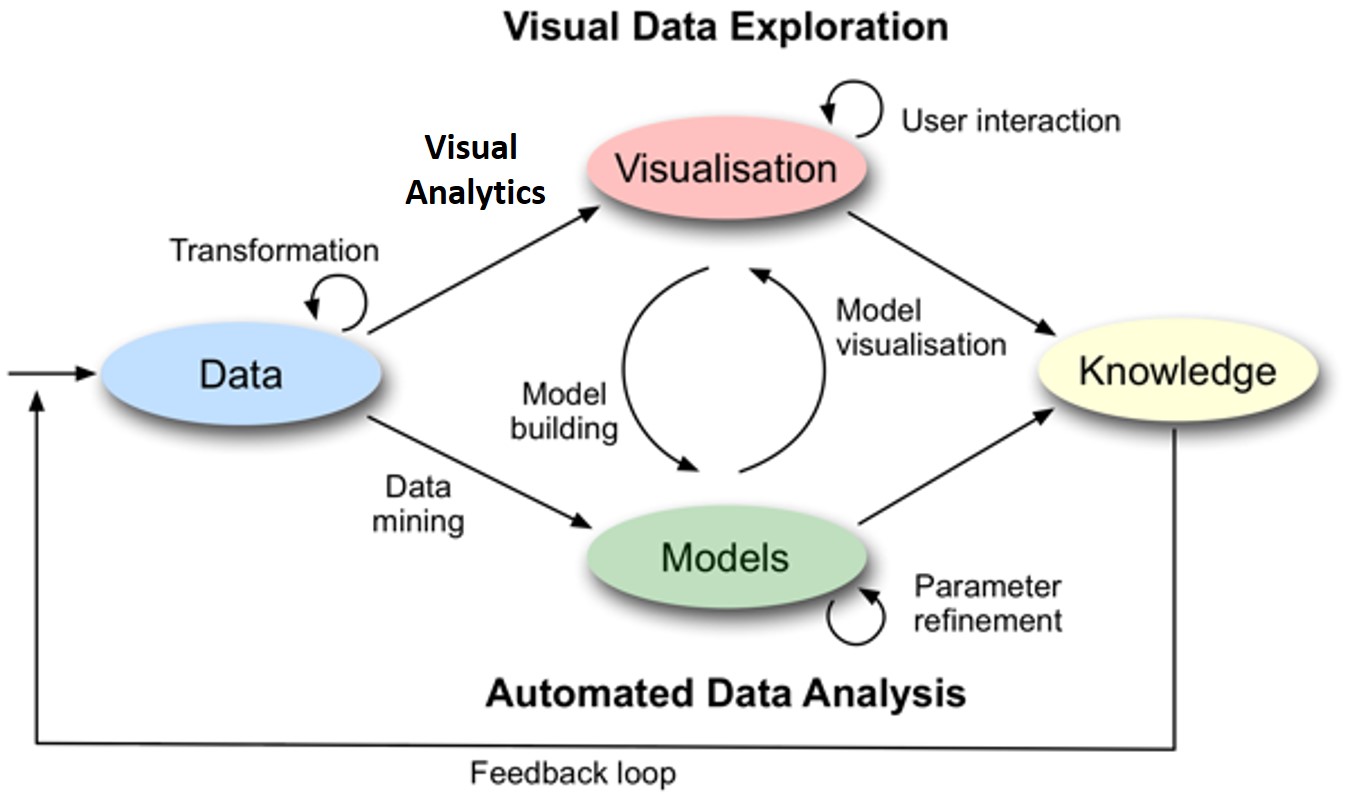
Visual Analytics Framework
What is Visual Analytics?
Visual Analytics require a shift of mindset
What is Visual Analytics?
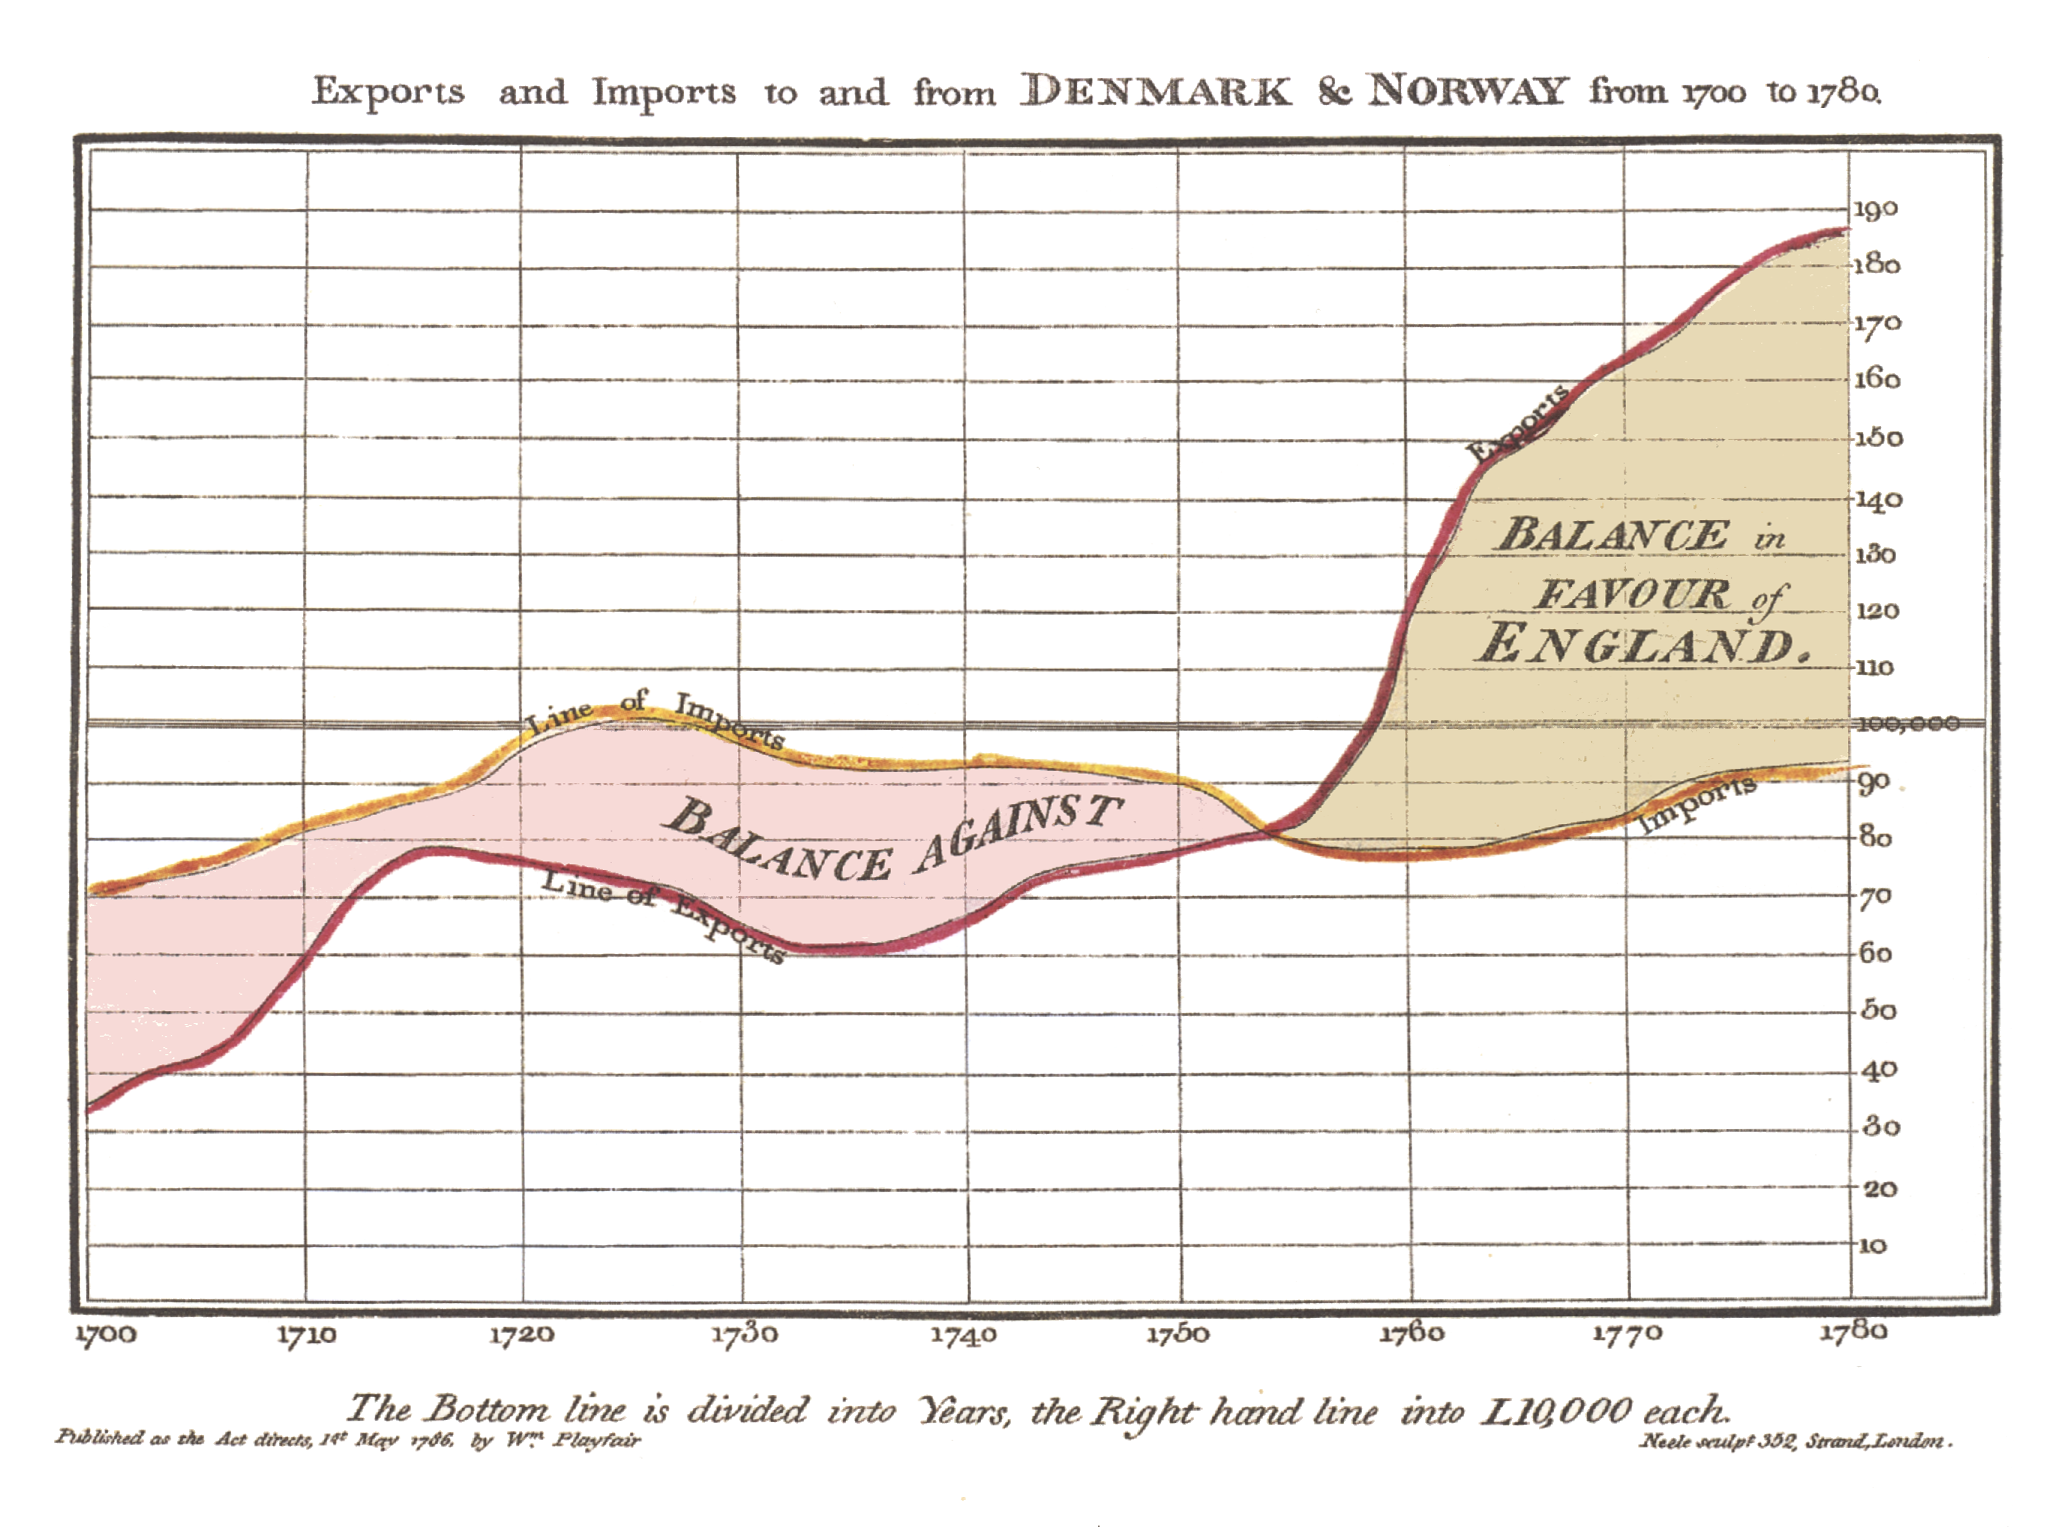
Learning from the history of Visual Analytics
Commercial and Political Atlas by William Playfair (22 September 1759 – 11 February 1823)
What is Visual Analytics?
Learning from the history of Visual Analytics
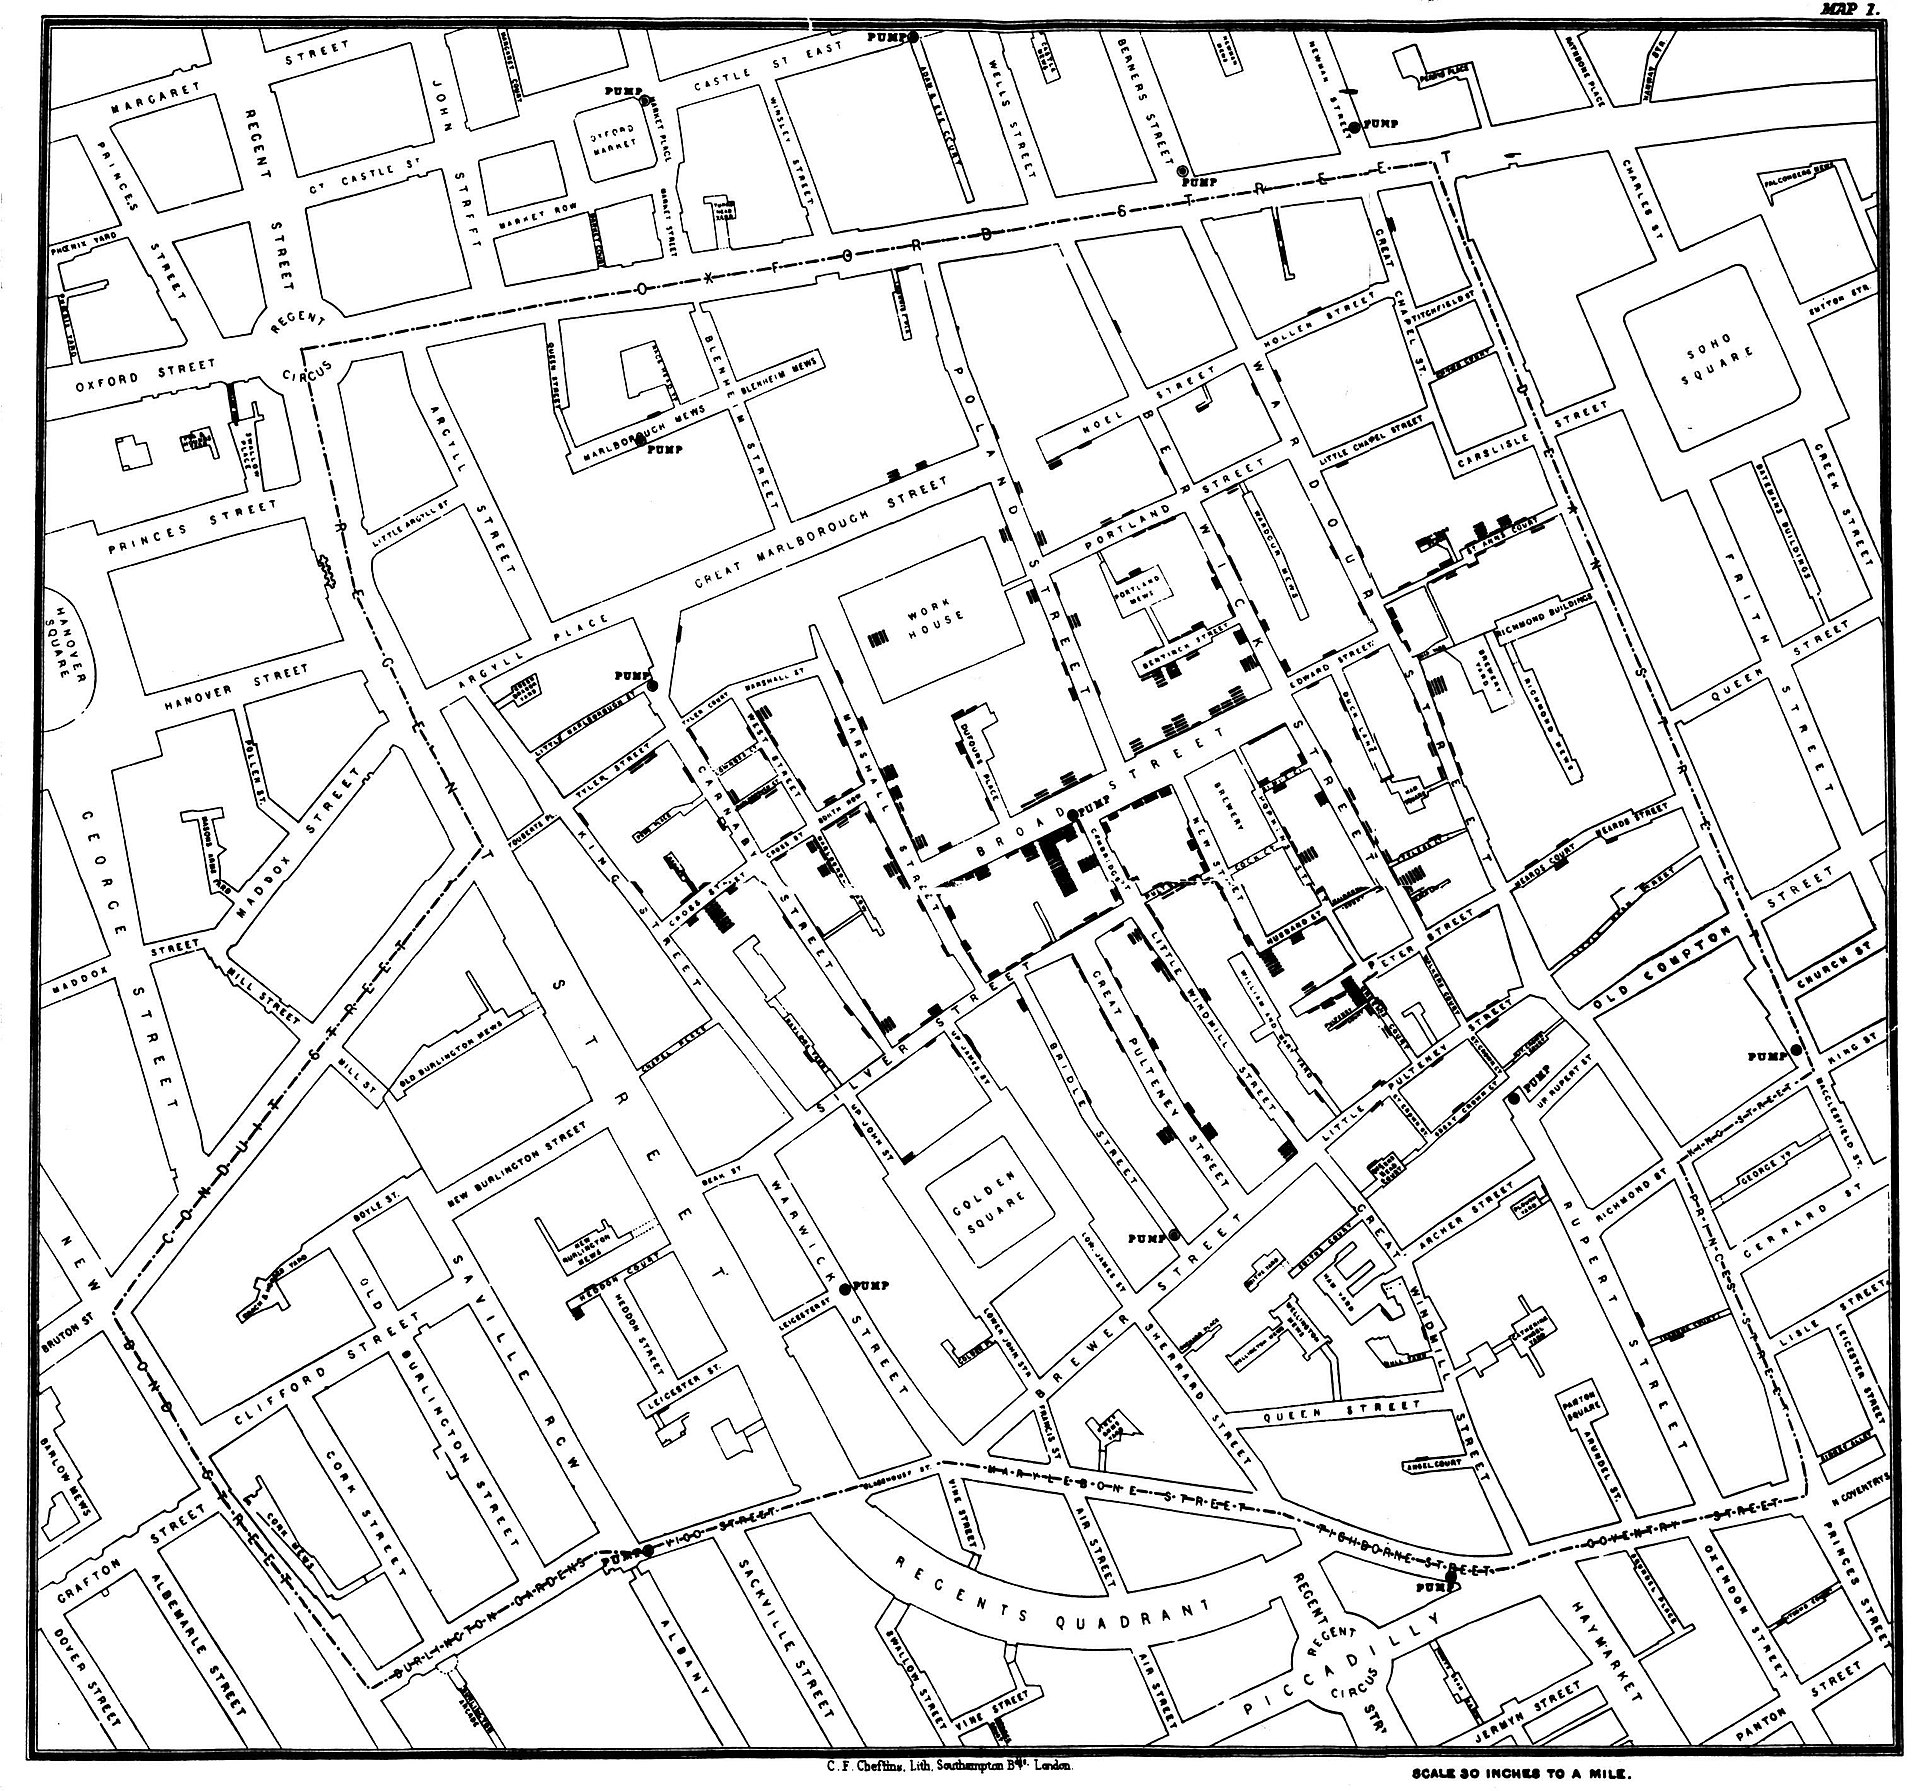
Cholera and the Pump on Broad Street(John Snow, 1854).
What is Visual Analytics?
Learning from the history of Visual Analytics
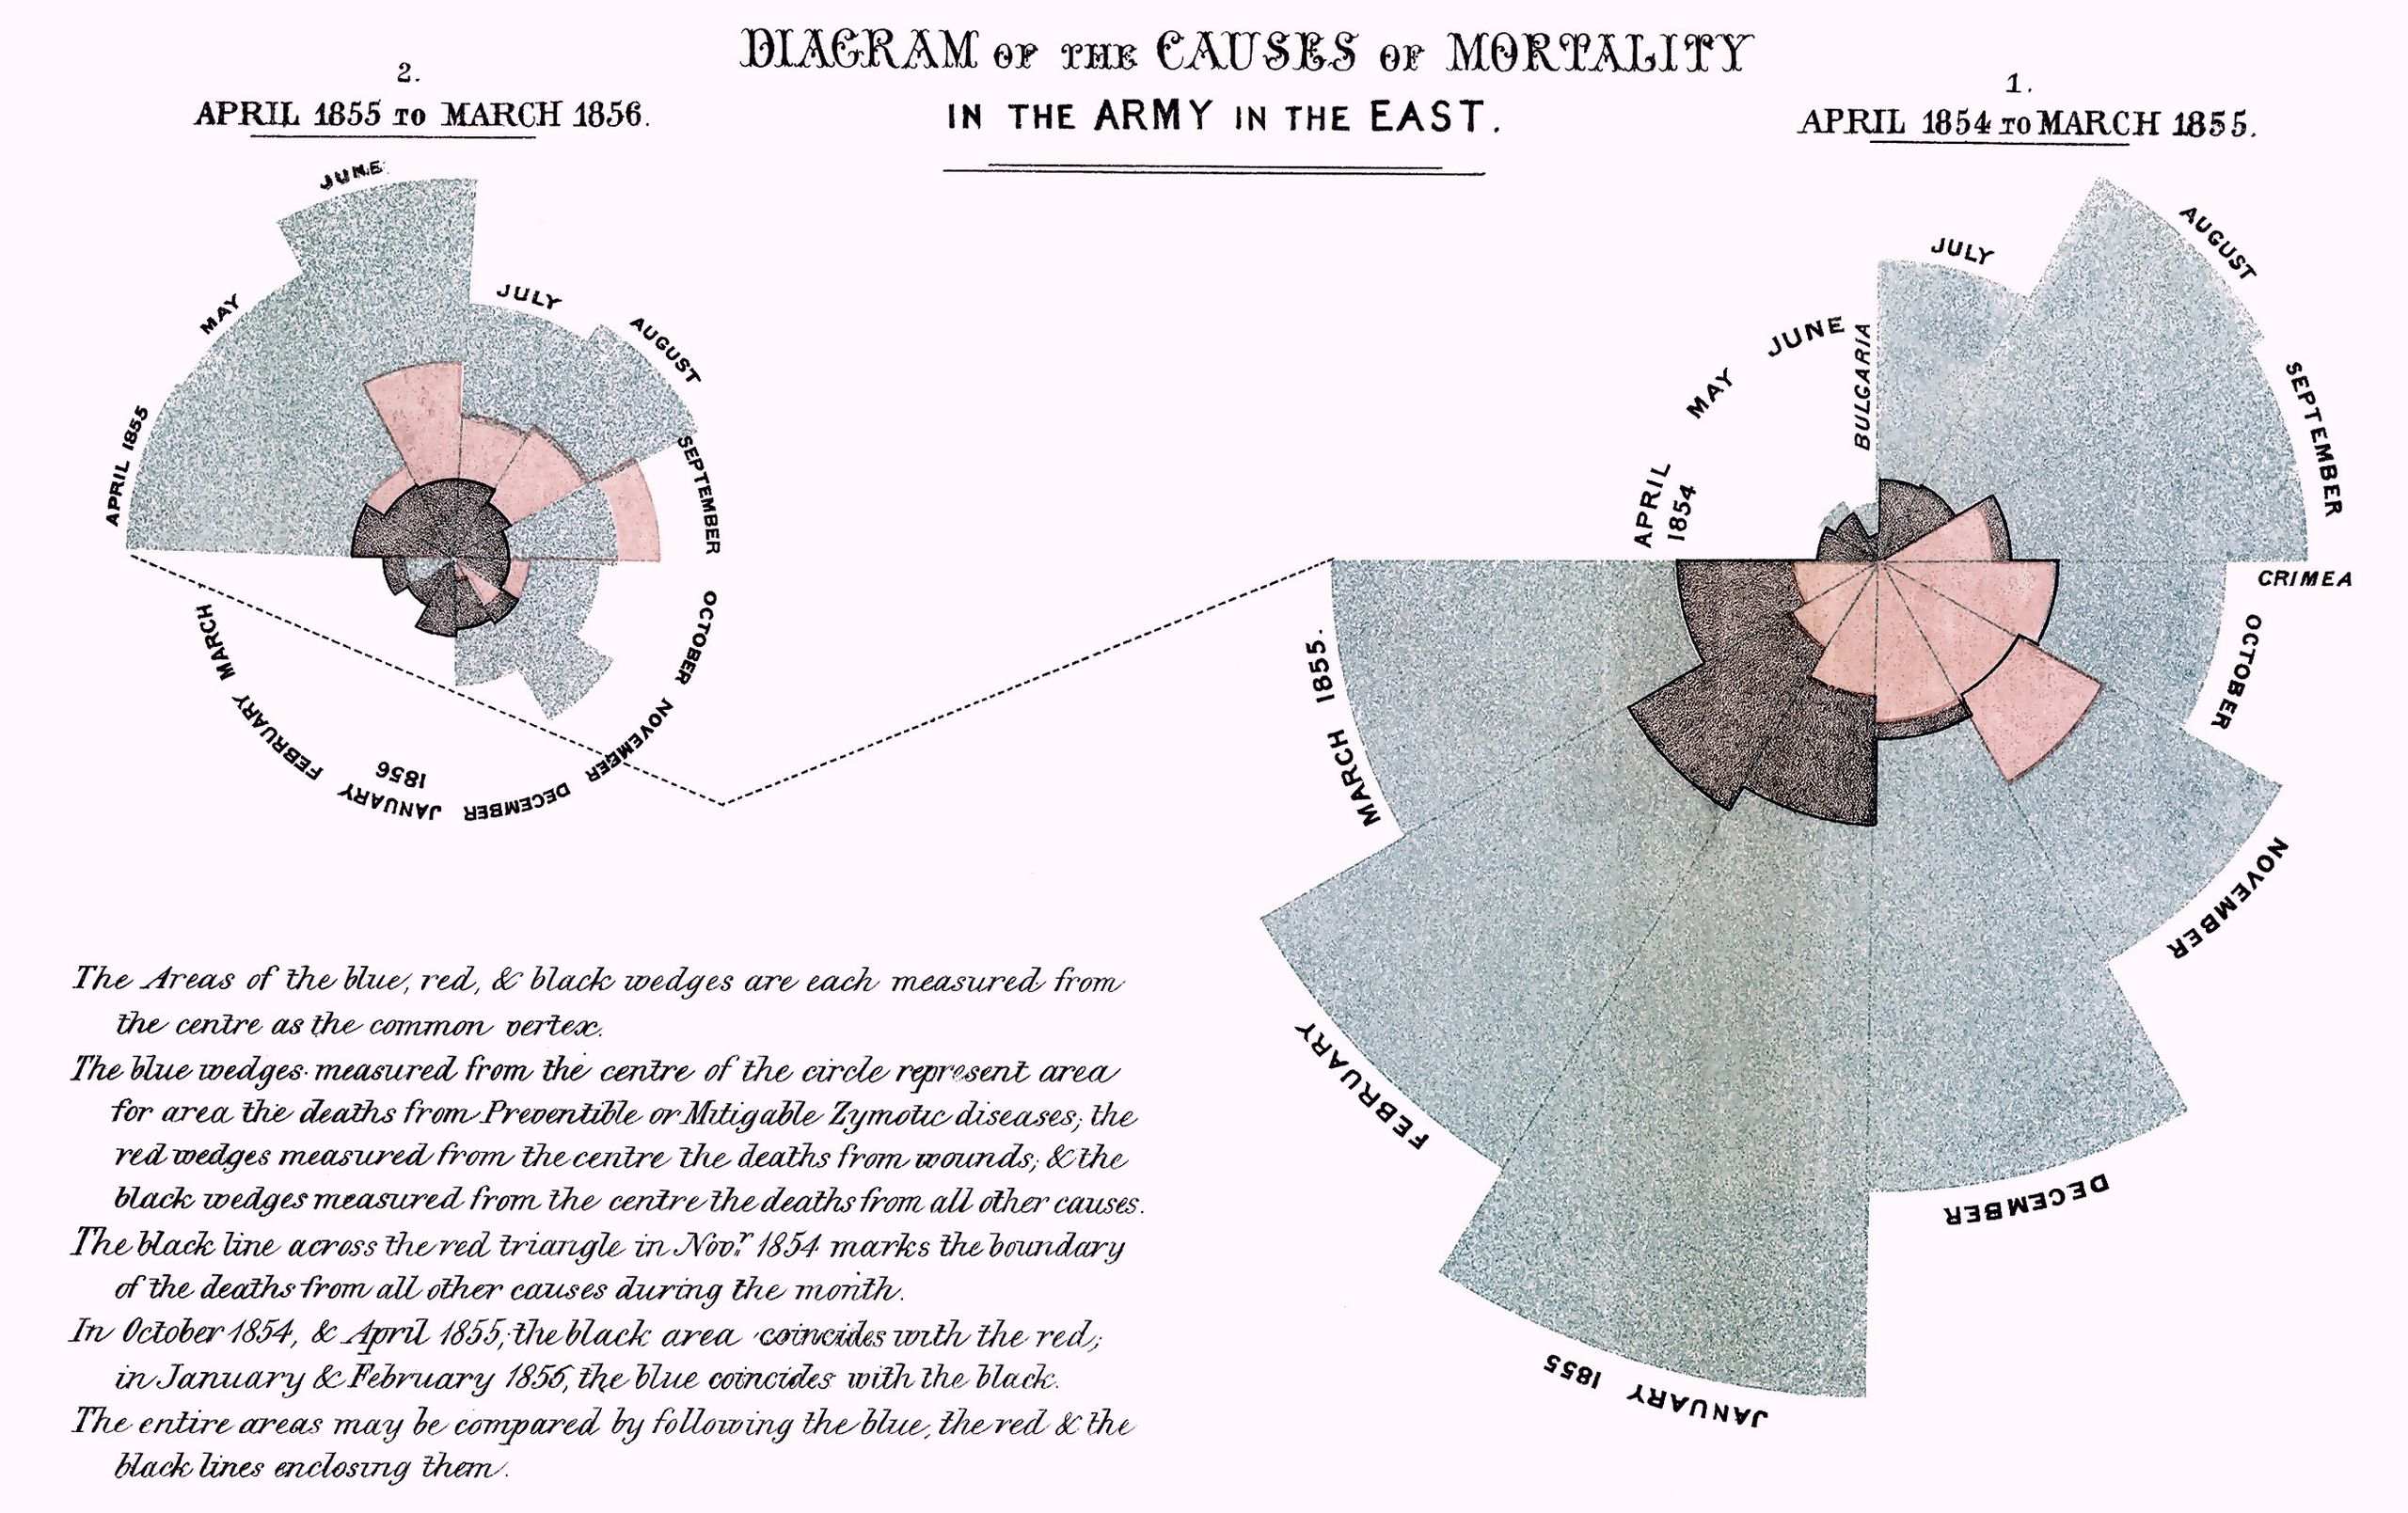
Florence Nightingale: The compassionate statistician(12 May 1820 – 13 August 1910)
What is Visual Analytics?
Learning from the history of Visual Analytics
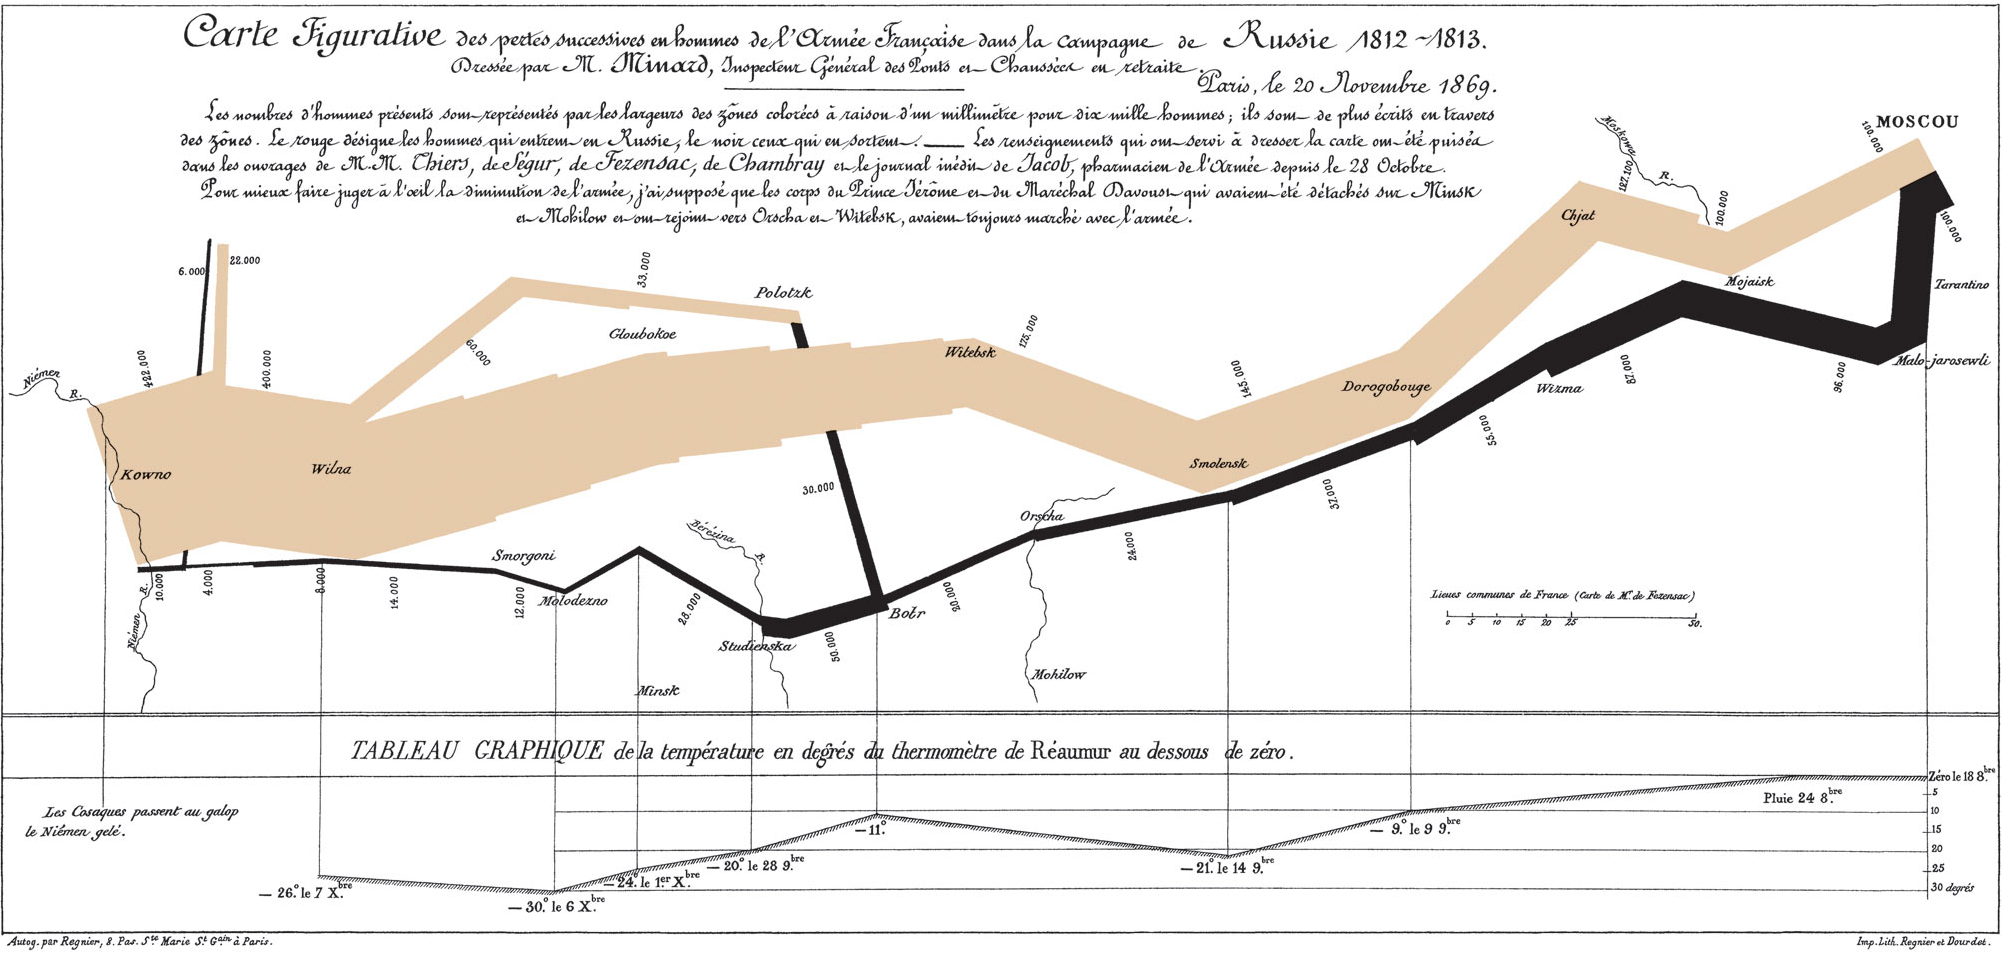
Plot of Napoleon’s ill-fated Russian campaign of 1812-1813 (Charles Joseph Minard,1861)
What is Visual Analytics?
Visual Analytics must be Reproducible
- For every result, keep track of how it was produced.
- Avoid manual data manipulation steps.
- Archive the excat versions of all external programmes used.
- Version control all custom scripts.
- Record all intermediate results, when possible in standard formats.
- For analysis that include randomness, note underlying random seeds.
- Always store raw data behind plots.
- Generate hierarchical analysis output, allowing layers of increasing detail to be inspected.
- Connect textual statements to underlying results.
- Provide public access to scripts, runs, and results.
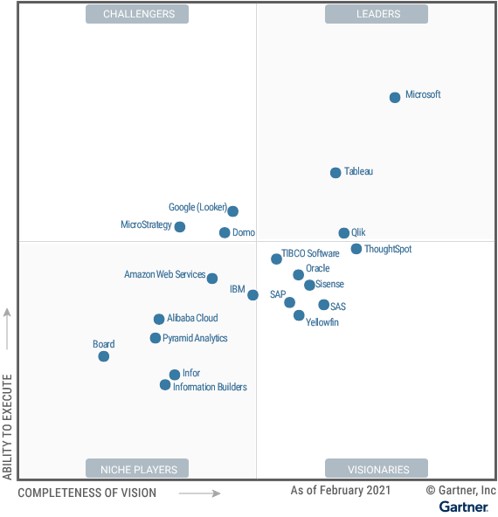
COS Data Visualisualisation Toolkit
Magic Quadrant for BI and Analytics Platforms
COS Data Visualisation Toolkit
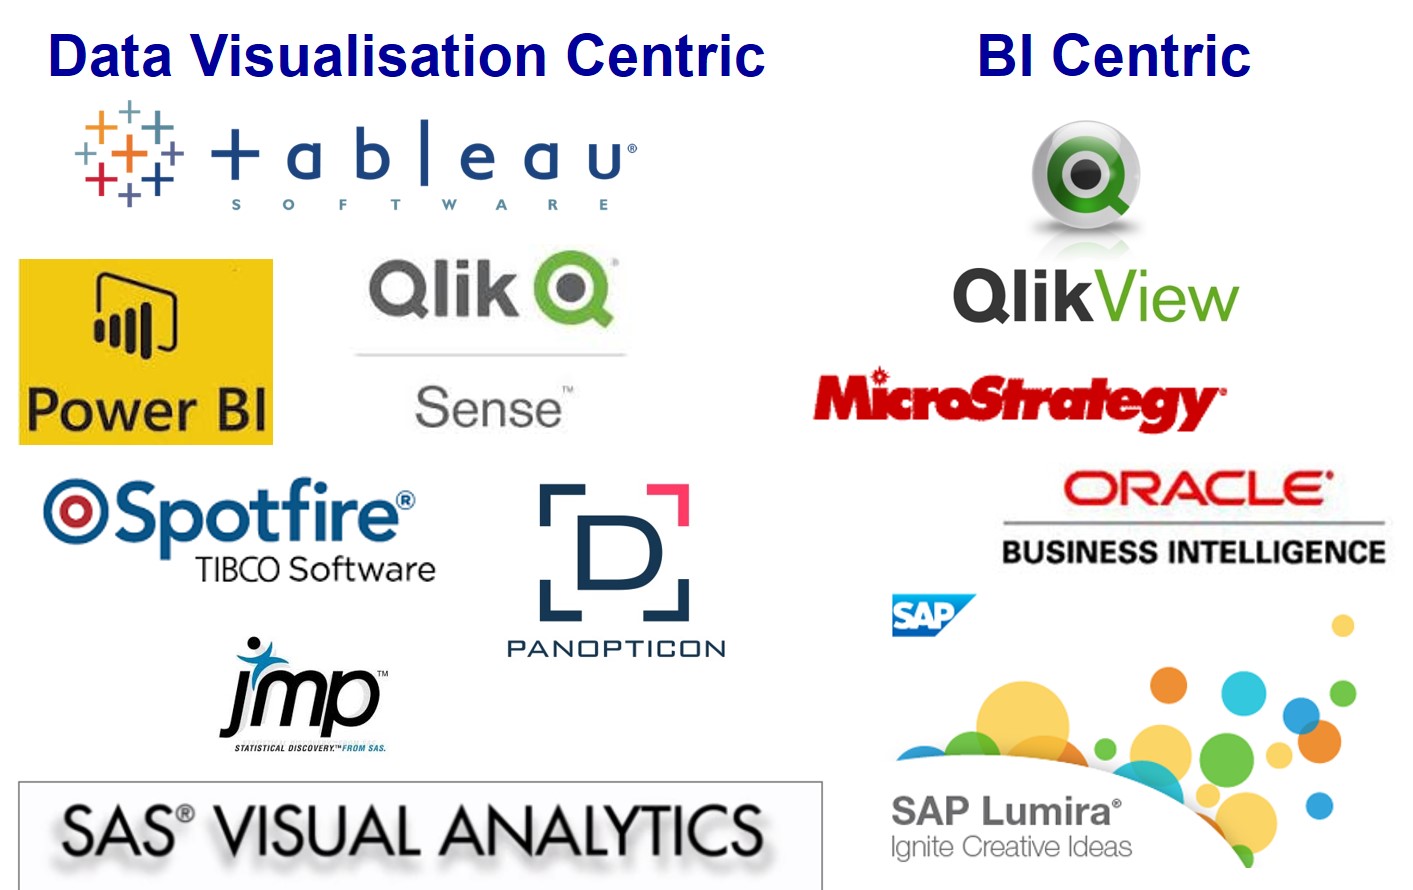
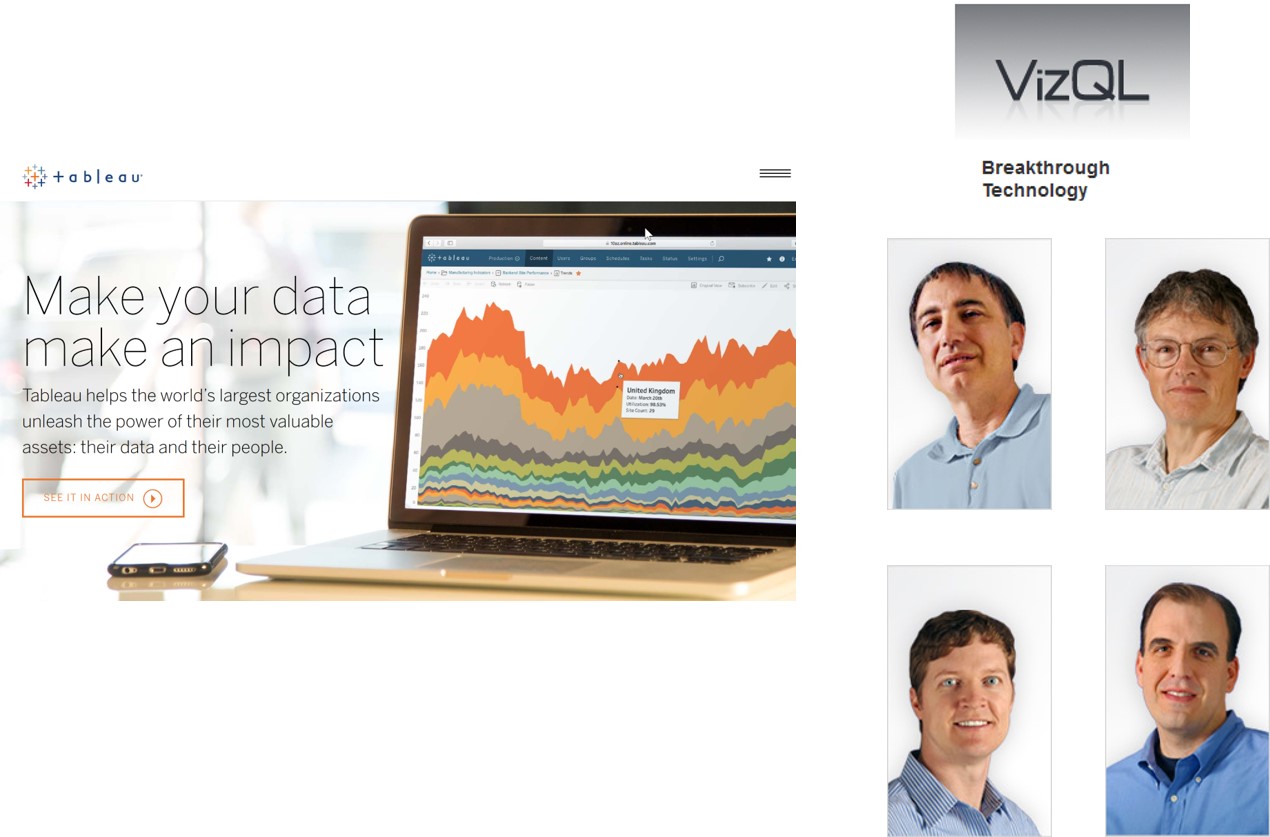
Tableau: A data visualisation tool for everyone
- Theory to practice
- The Grammar of Graphics
- Science to product
- VisQL
- Show Me
- Polaris